Next-session game plan
Caution Trigger
Stay under 740
As long as SPY stays under the 1-hour 55 EMA zone, the up move is weaker and failed bounces deserve more respect.
Key Reclaim
740 / 1H EMA55
That is the level bulls need back. It is the clean line between a damaged bounce and a repaired structure.
Bull Trigger
Close above 740
Bullish continuation only gets cleaner if SPY reclaims 740 and can actually close above it instead of rejecting there again.
The main takeaway is simple: price is under the 1-hour 55 EMA, so this is no longer a
clean momentum continuation spot. The burden is back on buyers to prove they can take
back 740 instead of getting trapped under it.
If SPY reclaims 740 and closes above it, the up move can repair and continue. If price
stays under 740, every bounce still has trap risk and needs to be treated more carefully.
1-year SPY chart
Broader trend backdrop with the short-term reclaim level in mind
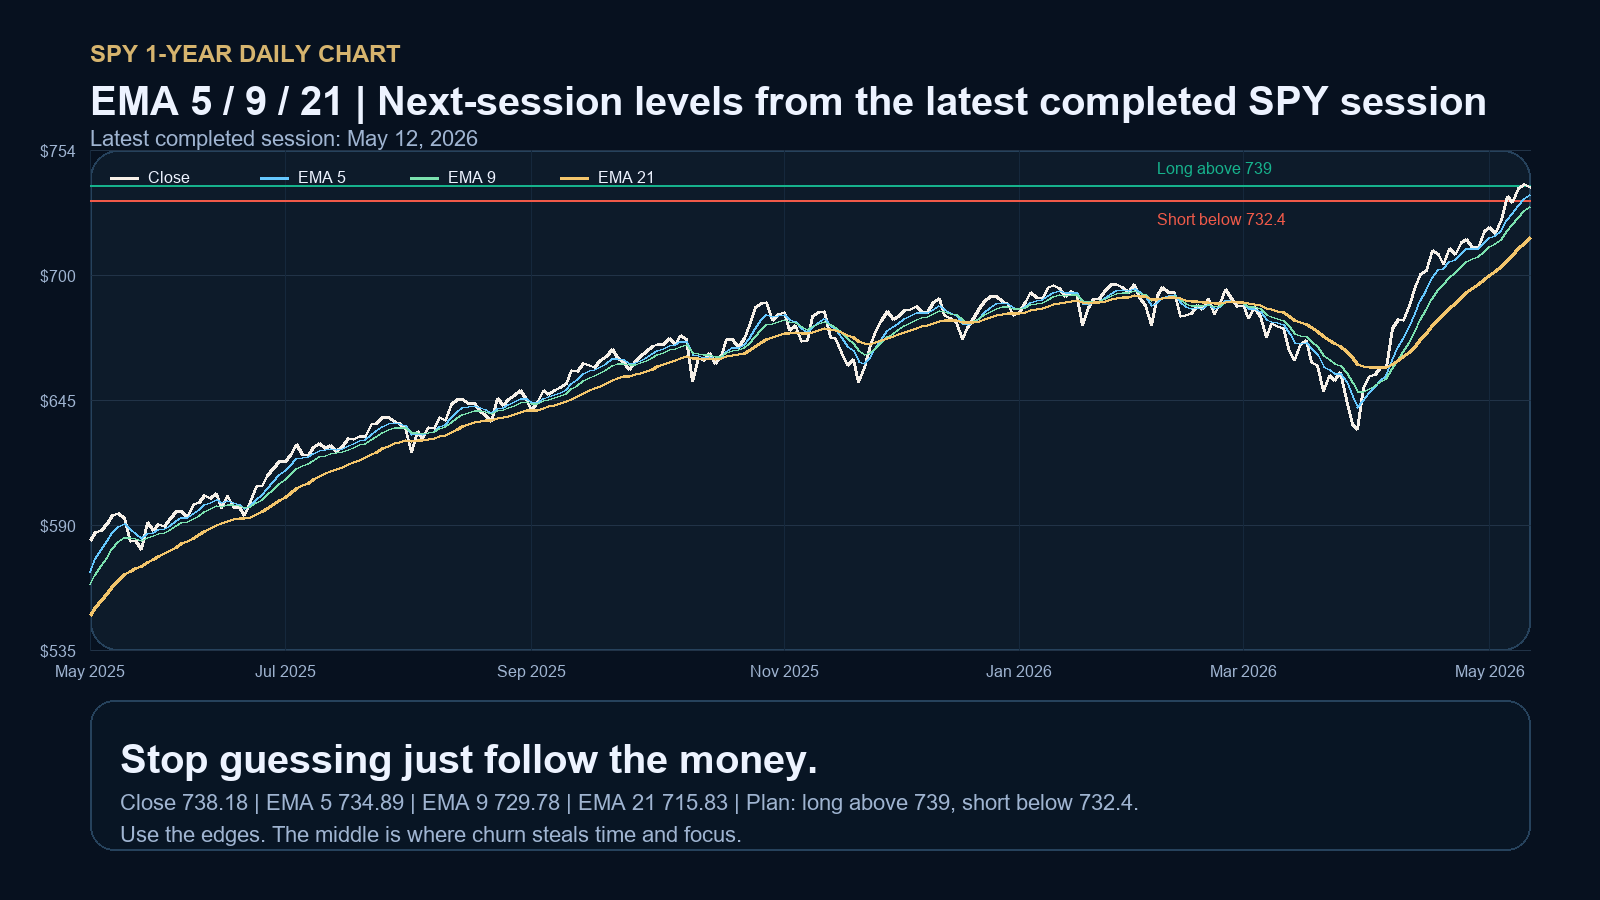
The bigger trend still matters, but the short-term tell is cleaner: price is under
the 1-hour 55 EMA right now, and 740 is the reclaim level to watch.
Trading plan: SPY is under the 1-hour 55 EMA, so watch out. Bulls need
a reclaim of 740 and a close above it to keep the up move going.